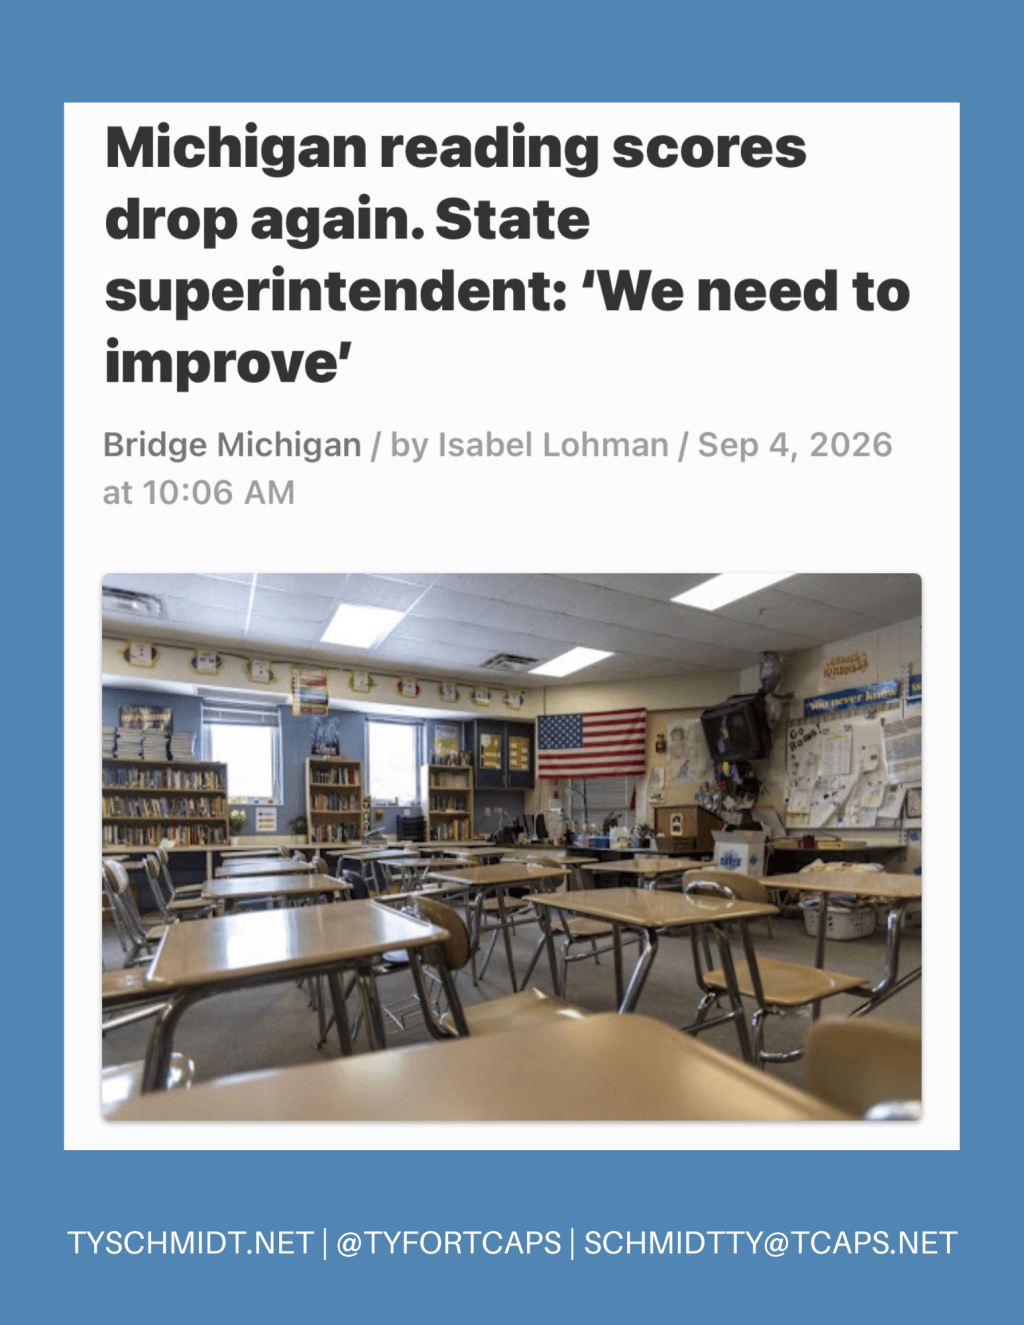
Our state assessment outcomes for 2025/26 were released to the public last week.
Below you’ll find a snapshot of how our students performed in reading, math, and college readiness.
I’ve included years of data for context (as well as outcomes for our economically disadvantaged kids and their peers)—and connected these outcomes to the goals in our 5-year strategic plan.
 You can look at our performance outcomes here: mischooldata.org → “K-12 Grade” → “State Testing” → “Grades 3-8” or “College Readiness” → search “Traverse City” or by individual school – ie. “[Cherry Knoll]”
*We’re using NWEA (not the state assessment – MSTEP) for our new strategic plan elementary school goals – you can see our most recent NWEA outcomes HERE.
Elementary: 3rd grade reading (MSTEP*)
All 3rd graders:
- 2026: 50% advanced or proficient (298/583 3rd graders)
- 2025: 49% (278/570)
- 2024: 58% (334/529)
- 2023: 52% (315/604)
- 2022: 56% (341/610)
- 2021: 52% (261/500)
Economically disadvantaged 3rd graders:
- 2026: 31% advanced or proficient (70/223 3rd graders)
- 2025: 38% (98/261)
- 2024: 40% (83/207)
- 2023: 37% (100/270)
- 2022: 40% (107/269)
- 2021: 29% (54/189)
Non-economically disadvantaged 3rd graders:
- 2026: 61% advanced or proficient (219/360 3rd graders)
- 2025: 58% (180/309)
- 2024: 67% (251/372)
- 2023: 64% (215/334)
- 2022: 68% (234/342)
- 2021: 67% (207/311)
Elementary: 4th Grade Math (MSTEP*)
All 4th graders:
• 2026: 37% advanced or proficient (216/578 4th graders)
• 2025: 44% (253/582)
• 2024: 42.% (264/625)
• 2023: 40% (243/609)
• 2022: 42% (235/564)
• 2021: 42% (246/583)
• 2019: 50% (309/620)
• 2018: 48% (348/727)
• 2017: 45% (296/658)
• 2016: 51% (351/694)
Economically disadvantaged 4th graders:
• 2026: 22% (53/244)
• 2025: 25% (55/222)
• 2024: 30% (79/266)
• 2023: 25% (64/257)
• 2022: 21% (45/216)
• 2021: 32% (71/225)
• 2019: 35% (88/252)
• 2018: 35% (111/320)
• 2017: 34% (92/269)
• 2016: 39% (95/251)
Non-economically disadvantaged 4th graders:
• 2026: 49% (163/334)
• 2025: 55% (198/360)
• 2024: 52% (185/359)
• 2023: 51% (179/352)
• 2022: 55% (190/346)
• 2021: 49% (175/358)
• 2019: 60% (221/368)
• 2018: 58% (237/407)
• 2017: 52% (204/389)
• 2018: 58% (256/443)
Middle: 8th Grade Math (PSAT)
All 8th graders:
- 2026: 49% advanced or proficient (303/622 8th graders)
- 2025: 37% (255/682)
- 2024: 47% (291/613)
- 2023: 53% (326/620)
- 2022: 52% (345/661)
- 2021: 49% (271/559)
Economically disadvantaged 8th graders:
- 2026: 28% advanced or proficient (54/196 8th graders)
- 2025: 22% (56/260)
- 2024: 23% (50/222)
- 2023: 31% (69/222)
- 2022: 36% (92/258)
- 2021: 39% (72/187)
Non-economically disadvantaged 8th graders:
- 2026: 58% advanced or proficient (249/426 8th graders)
- 2025: 47% (199/422)
- 2024: 62% (241/391)
- 2023: 65% (257/398)
- 2022: 63% (253/403)
- 2021: 53% (199/372)
High School: 11th Grade College Readiness Numbers (Total SAT)
All 11th graders:
- 2026: 47% met or exceeded college readiness benchmarks – 480 for Reading and Writing, and 530 for Math (291/626 11th graders)
- 2025: 47% (317/674)
- 2024: 41% (284/689)
- 2023: 45% (316/707)
- 2022: 44% (296/666)
- 2021: 50% (346/698)
Economically Disadvantaged 11th graders:
- 2026: 22% met or exceeded college readiness benchmarks – 480 for Reading and Writing, and 530 for Math (36/167 11th graders)
- 2025: 27% (59/216)
- 2024: 25% (54/217)
- 2023: 27% (50/185)
- 2022: 30% (65/214)
- 2021: 31% (50/160)
Non Economically Disadvantaged 11th graders:
2026: 56% met or exceeded college readiness benchmarks – 480 for Reading and Writing, and 530 for Math (255/459 11th graders)


Leave a Reply