Our 2023/24 annual education report was made public earlier this month on mischooldata.org.
It’s a 133-page beast that includes educator qualifications, student assessment, and accountability data.
Here are a few takeaways about educational equity and our economically disadvantaged kids:
3rd Grade Reading Proficiency (Michigan Student Test of Educational Progress – M-STEP)
- All students: 58%
- Economically Disadvantaged Students: 40%
- Non Economically Disadvantaged Students: 68%
3rd Grade Math Proficiency (M-STEP)
- All students: 55%
- Economically Disadvantaged Students: 35%
- Non Economically Disadvantaged Students: 66%
4th Grade Math Proficiency (National Assessment of Educational Progress – NAEP)
- All students*: 32% (proficient and advanced)
4th Grade Reading Proficiency (NAEP)
- All students*: 28% (proficient and advanced)
8th Grade Math Proficiency (Preliminary SAT – PSAT)
- All students: 48%
- Economically Disadvantaged Students: 23%
- Non Economically Disadvantaged Students: 62%
8th Grade Math Proficiency (NAEP)
- All students*: 26% (proficient and advanced)
8th Grade Reading Proficiency (NAEP)
- All students*: 28% (proficient and advanced)
11th Grade Career and College Readiness (total Standard Assessment Test – SAT – score)
- All students: 41% met or exceeded
- Economically Disadvantaged Students: 25% met or exceeded
- Non Economically Disadvantaged Students: 49% met or exceeded
Graduation Rates
Our recent graduation rates*:
- 2019/20: 91%
- 2020/21: 87%
- 2021/22: 86%
- 2022/23: 84%**
- 2023/24: 88%**
*4-year graduation rates
**Graduation rate for our economically disadvantaged students in 2022/23 = 68%. In 2023/24 = 74%.
Advanced Coursework** (percent of students in grades 11 and 12 enrolling and passing in advanced coursework)
Central High School
- All students: 50%
- Economically Disadvantaged Students: 37%
West Senior High School
- All students: 61%
- Economically Disadvantaged Students: 47%
Traverse City High School
- All students: 9%
- Economically Disadvantaged Students: 6%
Early Middle College Enrollment*** (5 year program that allows students to earn post-secondary outcomes while in high school)
Central High School
- Economically Disadvantaged Students: 24%
- Non Economically Disadvantaged Students: 76%
West Senior High School
- Economically Disadvantaged Students: 18%
- Non Economically Disadvantaged Students: 82%
Traverse City High School
- No data available for 2024 (most recent is 2019)
I’ll be sharing more takeaways soon but here’s the report if you’re curious.
*no data was provided for our economically disadvantaged kids for the NAEP scores however, according to this January 29, 2025 Ed-Trust Midwest story,
“For students from economically disadvantaged backgrounds, the picture is even more troubling. Only 13% of Michigan’s 4th graders from economically disadvantaged backgrounds scored at or above proficient on the NAEP reading assessment in 2024, down from 16% in 2022 and below the national average of 19%. On the 8th grade math assessment, only 12% of Michigan students from economically disadvantaged backgrounds scored at or above proficient, down from 13% in 2022 and below the national average of 14%.”
** from Parent Dashboards for School Transparency on mischooldata.org
*** from Early Middle College Enrollment and Outcomes report on mischooldata.org
LATEST EQUITY AND STUDENT ACHIEVEMENT POSTS
- Supporting Our Mavericks
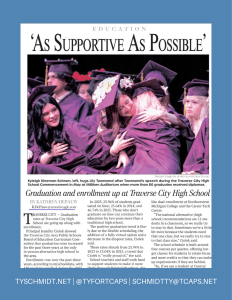 A really encouraging story in today’s Traverse City Record-Eagle about Traverse City High School. Over the past three years, the school’s on-time graduation rate has nearly doubled, from 23.9% in 2023 to 46.7% in 2025, while the dropout rate fell from… Read more: Supporting Our Mavericks
 - Assessments Should Help Us Teach, Not Just Tell Us What Happened
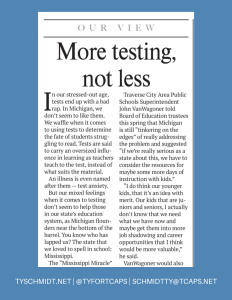 I appreciate the Traverse City Record-Eagle‘s willingness to put education and Michigan’s literacy challenges in the spotlight in today’s paper.* It’s an important conversation, and one I think all of us – educators, parents, school board members, legislators and community members… Read more: Assessments Should Help Us Teach, Not Just Tell Us What Happened
 - August Newsletter
 August’s newsletter is out – have a great rest of the summer, everyone! • 2026 elementary school math/literacy outcomes • 2026 secondary school math/literacy outcomes • Looking beyond the classroom: Lessons from the Kids Count report • Community partnerships: Creating the… Read more: August Newsletter
 - Keeping Our Promise: Reporting on the Outcomes We’ve Chosen to Prioritize
 One of the promises we made as a Board was to be transparent about the outcomes we’ve chosen to prioritize—and to report our progress along the way. At last week’s Curriculum Committee meeting, we reviewed several of our secondary strategic plan… Read more: Keeping Our Promise: Reporting on the Outcomes We’ve Chosen to Prioritize
 - Measuring What Matters: A First Look at TCAPS’ Progress Toward the 2030 Vision
 One of the commitments we made in our new 2030 Vision* was to measure what matters—and to share our progress along the way. At yesterday’s Curriculum Committee meeting, we reviewed our latest elementary reading and math outcomes using the NWEA, our… Read more: Measuring What Matters: A First Look at TCAPS’ Progress Toward the 2030 Vision

 TY FOR TCAPS
Leave a comment